
Higher education estates
Measuring the difference: a controlled facility management experiment at Toyo University
Most campuses run on paper, 2D drawings and folders of PDFs spread across unconnected systems. Toyo University ran a controlled comparison against a spatial approach, and timed both. The gap was large enough to be worth publishing.
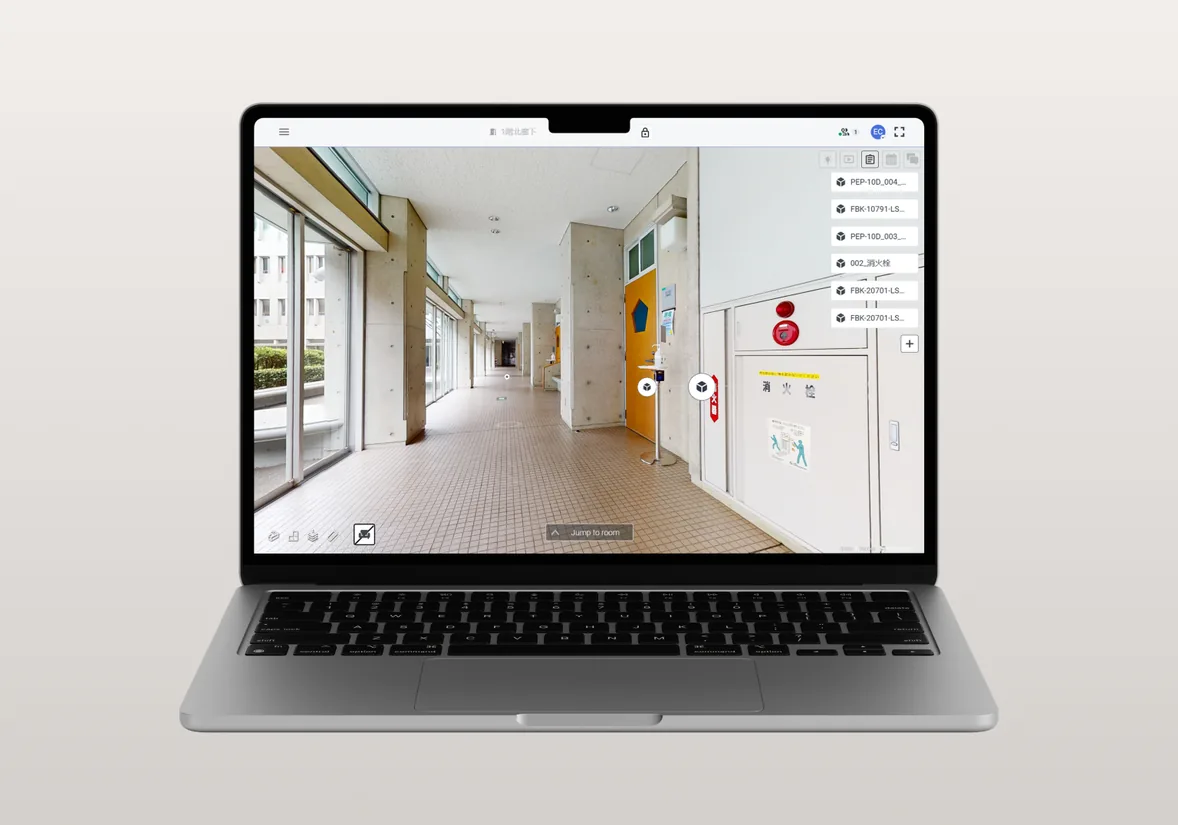
- Institution
- Toyo University
- Led by
- Associate Professor Shuhei Tazawa, Department of Architecture
- Campus
- Kawagoe, Faculty of Science and Engineering
- Scope
- One building, captured with a Matterport Pro2
- Assets tagged
- 112, with documents and schedules attached
- Method
- Traditional workflow timed against SIM-ON
What actually changed, in the numbers the project reported.
Every figure below comes from the published account of this deployment. Where a before and after was measured, both are shown.
About 92%
Less time finding maintenance history
11m 52s56s
Measured on the same search task in both workflows.
About 55%
Less labour time on an HVAC outage
5h 50m2h 36m
A simulated failure run through both workflows end to end.
112
Assets tagged in the building
Fire extinguishers, hydrants, HVAC equipment, emergency lighting, fire doors and speakers among them.
COBie
Inspection layer exported
Items subject to mandatory inspection were exported to build a consistent as-built.
Fragmented documentation, and a clock nobody had started
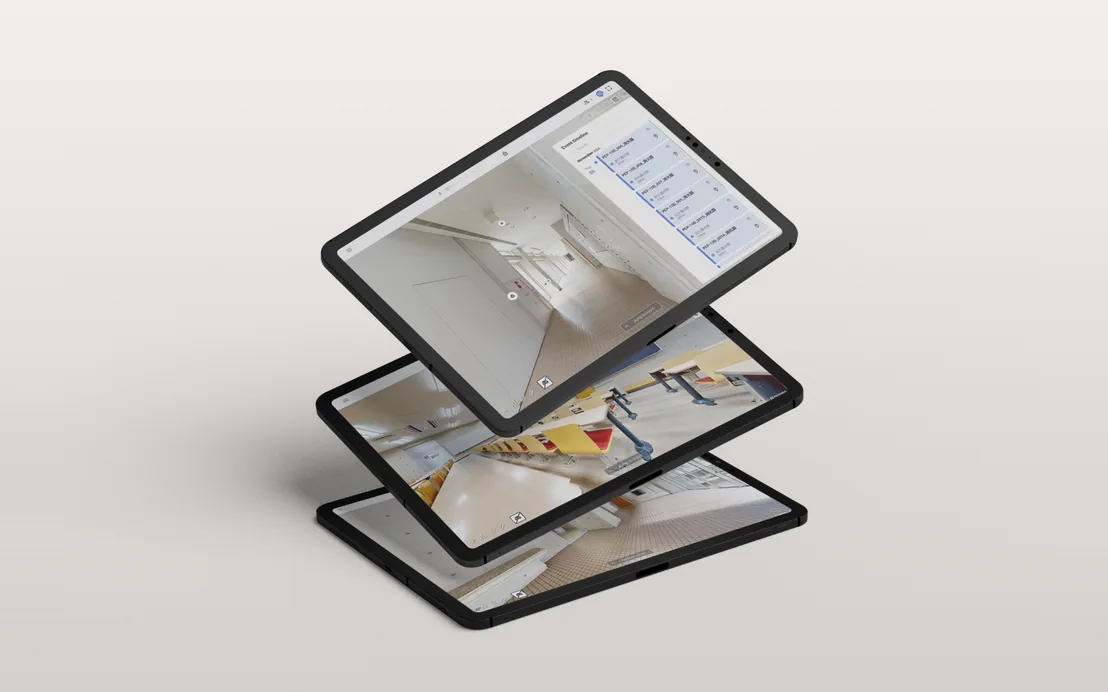
University facilities teams work across fragmented documentation and tools. Toyo put it plainly: paper based maintenance anchored in 2D drawings slows work down, because the information is not consolidated and is hard to find at the moment it is needed, during an inspection or a repair.
There is a second problem underneath the first. When knowledge lives in habit and in individuals, staff turnover carries real risk with it, and the error rate goes up exactly when experienced people leave.
What made this project unusual is that nobody argued about it in the abstract. An experiment led by Shuhei Tazawa, Associate Professor in the Department of Architecture at the Kawagoe campus, set out to test whether a spatial interface built on a Matterport scan and SIM-ON genuinely reduces time, and to measure by how much.
Walk through it
How the experiment was set up
Stepped through the way the experiment ran it, from an unscanned block to a timed comparison between two ways of working. The building drawn here follows the character of Toyo's Kawagoe campus, where the Department of Architecture sits: precast grey blocks with ribbon glazing, set in woodland. The published account does not name the building that was scanned, so this is the type rather than the specific block.
Step 1 of 7
The building
A Kawagoe campus teaching block, running the way most campuses run: paper records, 2D drawings, network folders of PDFs, and separate maintenance and building automation systems.
The sequence the project actually followed.
Nothing here started with the software. Each step exists because the one before it produced something the next one could use.
- Platform surfaces
- SIM-ON, Reality Capture
- 01
Capture one building
A building was selected and captured with a Matterport Pro2, and a 3D model was created from the scan.
- 02
Attach the operational data
112 assets were tagged, each with its linked PDFs, images, videos, alarms and inspection schedules available in place on the virtual object rather than in a folder.
- 03
Build the inspection layer
Items subject to mandatory inspection were exported to COBie, producing a consistent as-built with an inspection layer over it.
- 04
Run both workflows and time them
The traditional method, meaning paper, 2D drawings, network folders of PDFs and separate maintenance and automation systems, was compared against working directly from the 3D model with a timeline and ticketing. Measured activities included finding instructions and plans, logging a fault, assigning a task, and updating status.
- 05
Connect the existing systems
The building automation system already in place was connected, with a successful read of selected KNX sensors, confirming the platform was ready for wider use rather than only for the test.
What the measurements showed
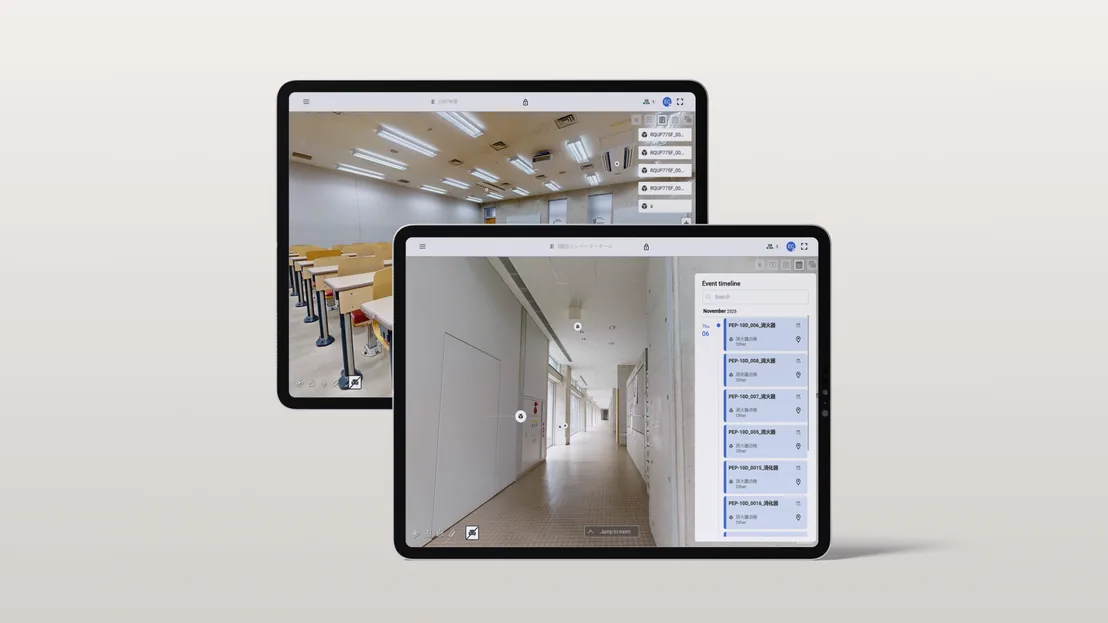
On a simulated HVAC outage, the traditional route took 5 hours 50 minutes of labour. Working from the model it took 2 hours 36 minutes, about 55 percent less. The time went out of the process because specifications and device history opened directly from the equipment, and because photographs, notes and statuses stayed in a single stream instead of being reassembled from several.
On finding maintenance history and schedules, the traditional route took 11 minutes 52 seconds. From the model it took 56 seconds, about 92 percent less. The step that disappeared was the translation: turning a room number and an inventory code into a folder path. Clicking the object opened the right records.
Communication and accountability improved for a plainer reason. One model, one timeline and one ticket queue cut down arguments about which file version was current, and made shift handovers and activity audits easier because everything was described in the context of a place.
The experiment also surfaced something that is not a technology finding at all. Organisational change matters as much as the tooling, and long standing habits among service vendors can work against centralising knowledge with the owner. The value shows up when the owner genuinely holds the building's geometry and inspection lists.
What a campus does with this
A digital twin on a campus is not only an operations tool. Architecture, construction and engineering students can study real installations, work through scenarios and design optimisations against a functioning site, which makes the same model a teaching platform.
On integration, SIM-ON monitors IoT and BMS endpoints such as KNX and NETxAutomation, and integrates with maintenance and asset platforms including IBM Maximo where a connection is in place. That gives technical, service and operational data one spatial interface instead of several.
There is an environmental angle worth naming honestly: less paper means a smaller footprint, and sensor data read in spatial context makes energy anomalies easier to spot and occupant comfort easier to act on.
This approach tends to fit when:
- Estates that already have a maintenance system and a building automation system, but no single place where the two meet.
- Teams that need to justify a change with measured time savings rather than a demonstration.
- Organisations facing turnover in experienced facilities staff, where knowledge currently leaves with the person.
- Campuses and institutions where the same model can serve operations and teaching at once.
Want the same record for your own building?
Most engagements start with one building or one technical zone, so the value is visible before anything wider is committed to.